Optimizing Data Visualization: How Aggregation Can Improve Performance

In today’s data-driven world, whether you’re an experienced e-commerce entrepreneur or anyone else, harnessing the power of data is paramount. We rely on data to inform our decisions, track progress, and uncover hidden insights. One common task, often underestimated in complexity, is visualizing data over extended periods. In this article, we’ll explore the challenges of visualizing extensive time-series data and share strategies to optimize performance. We’ll focus on how data aggregation can drastically reduce the dataset’s size while maintaining its representational value.
The Challenge: Visualizing Time-Intensive Data
Imagine you’re a data-driven e-commerce entrepreneur, running a successful online store. To refine your business strategy and make informed decisions, you decide to visualize your store’s total sales data over an extended period. It seems straightforward — a mere graphical representation of data, right? However, as you delve deeper into this task, you soon encounter a formidable challenge: performance issues that threaten to slow down your analytical processes.
Understanding the Performance Bottlenecks
- Data Volume Overload: The primary hurdle you face is the sheer volume of data. Accumulating a substantial amount of time-series data, be it for one year, seven years, or any extended duration, results in a massive dataset with potentially millions of data points. Attempting to load and process this extensive dataset in real-time becomes akin to trying to sip from a firehose. Your computing resources may struggle to cope, leading to slow response times and potential system crashes.
- User Experience: If you intend to present these graphs in a user-facing application or dashboard, slow loading times can frustrate users, undermining their engagement with your analytics. This, in turn, can have tangible consequences for your e-commerce business.
Optimization Strategy: Data Aggregation for Efficiency
Now that we’ve unraveled the challenges, let’s explore the power of data aggregation as one of the solution to optimize the performance of visualizing extensive time-series data:
Data Aggregation: Instead of plotting the raw daily data, consider aggregating the data into more manageable intervals, such as weekly or monthly summaries. This strategy drastically reduces the number of data points while preserving the essential trends and patterns. In essence, you’re looking at the forest instead of each individual tree.
- Example: Let’s say you have two years of daily sales data for your online store. This amounts to over 700 data points. By aggregating this data into monthly summaries, you reduce the dataset to just 24 data points — one for each month. The resulting graph is much easier to visualize, loads faster, and still conveys the overall sales trend. This transformation simplifies complex data into a clearer, more manageable format.
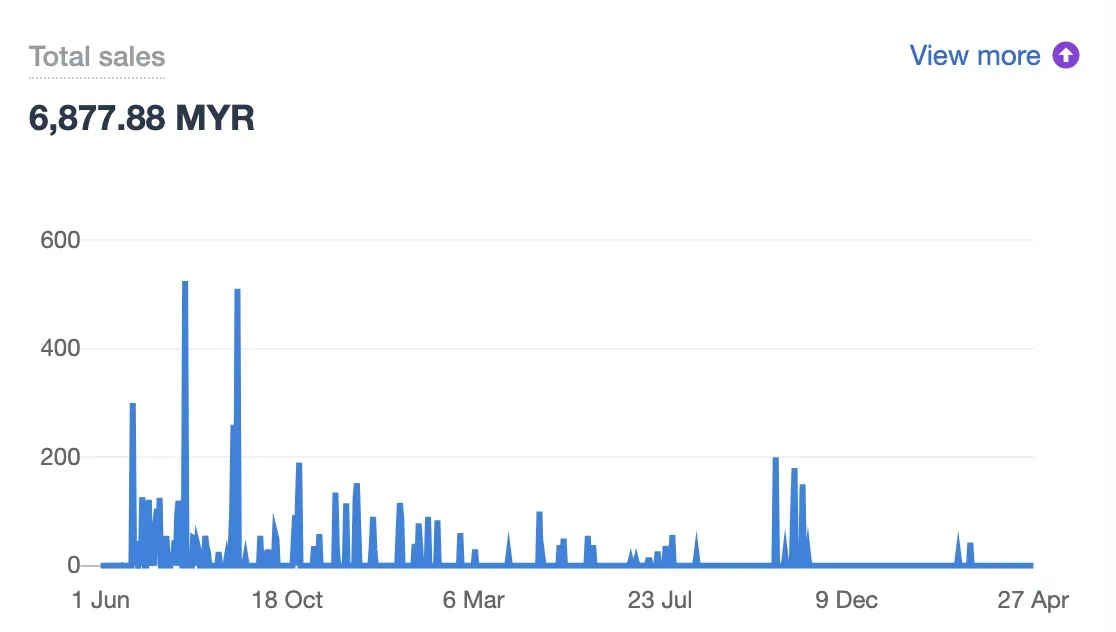
Visual Comparison: To illustrate the impact of data aggregation, consider these two scenarios:
- Daily Data (700 data points): Visualizing your sales data on a daily basis results in a cluttered graph with numerous data points. While it captures fine-grained fluctuations, it can be overwhelming, especially when attempting to identify long-term trends.
- Monthly Aggregated Data (24 data points): Aggregating your data into monthly summaries produces a cleaner, more concise graph. It retains the crucial insights about sales trends while eliminating the noise of daily fluctuations, offering a broader view of your business’s performance.
Conclusion: Efficiency Through Data Aggregation
Visualizing extensive time-series data no longer needs to be a daunting task. By strategically implementing data aggregation, you can conquer the challenges, ensure smooth performance, and extract valuable insights to drive your decisions forward.
From a business perspective, it’s important to recognize that not all data requires the same level of granularity. While daily or even hourly data may be crucial for specific scenarios, such as monitoring real-time trends or responding to immediate changes, monthly data often suffices for broader insights and strategic decision-making. Striking the right balance between granularity and performance can result in a more efficient use of computational resources, ultimately enhancing your ability to extract actionable insights from your data.

